After weeks of anticipation, the Bitcoin price has officially broken above key resistance levels, closing May 20 at $106,841 — its highest daily close in history. The move confirms a strong continuation of the rally that began in mid-April, but questions now loom about what’s next.
Daily Chart Signals Strength, but Overhead Risks Remain
Looking at the current daily chart, BTC has clearly broken out from the previous consolidation zone around $105K. Volume remains steady, suggesting that the breakout was backed by real buying power rather than a low-liquidity push.


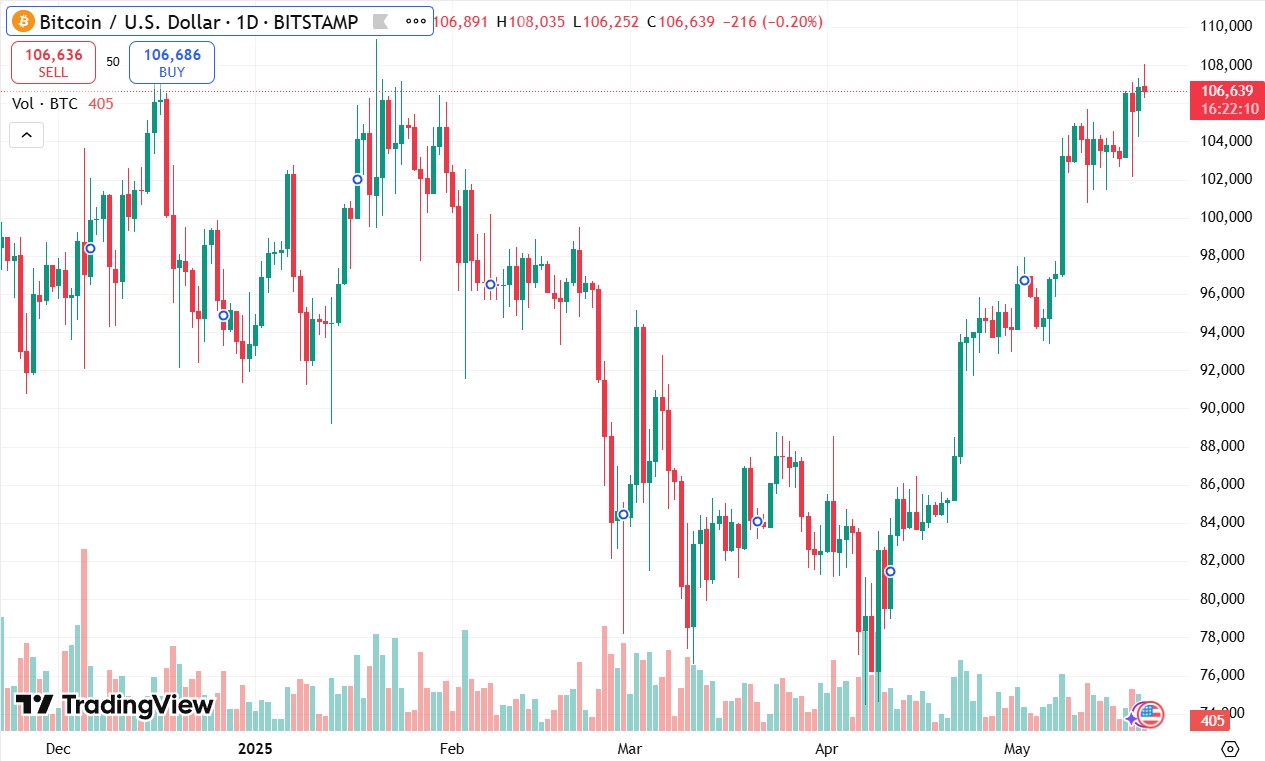
Source: Tradingview
The candle structure over the past few sessions shows bullish continuation, with higher highs and higher lows. Yesterday’s close just under the daily wick high ($108,035) could hint at short-term profit-taking, but no clear reversal signals have emerged yet.
A close above $107,000 on strong volume in the next 24 hours could ignite a push toward $110,000, while a dip below $104,500 might suggest a retest of prior support.
The Road Here: A Month of Gains and Momentum
Since early April, Bitcoin has climbed from below $83K to over $106K, fueled by a mix of strong ETF inflows, institutional purchases, and growing momentum in the macroeconomic narrative. Last week’s breakout above the $100K psychological level triggered a technical acceleration, with the price running nearly 7% in two days.
This upward leg has erased the March correction, and momentum indicators like the RSI still show room before entering extreme overbought territory — a sign that bulls may still have fuel.
Bitcoin Price – What to Watch Next
The short-term target now shifts to the $108K–$110K zone, where sell walls are likely to cluster. If this range is broken with conviction, we could be looking at a run toward $115K as the next macro target.
Final Thoughts
Bitcoin’s record close at $106,841 is not just a number — it’s a psychological victory for bulls and a strong technical breakout on the charts. With ETF inflows still robust and macro sentiment supportive, the current move could evolve into a full breakout leg — as long as the price holds above $104K.
The next 48 hours will be crucial. If momentum persists and buyers defend key support levels, we could soon witness the start of Bitcoin’s next parabolic run.On the downside, keep an eye on $104,500 and $102,000 as levels of support. A breakdown there would shift the narrative toward consolidation rather than trend continuation.