The Bitcoin rally shows no signs of slowing down. On May 23, bitcoin price touched a new all-time high of $112,000, pushing the crypto market further into bullish territory.
While excitement is building, the real story lies beneath the surface — in the data that explains how healthy this move really is. Today, we break down the key signals driving this surge and what they tell us about what comes next.


Bitcoin Price Action: Clean Breakout, No Resistance Above
Bitcoin’s recent move from $97K to over $112K in just two weeks has been nothing short of explosive. On the daily chart:
- Bitcoin price closed above $110K with strength, confirming a clean breakout
- Volume remains elevated but not overheated
- No significant historical resistance levels remain above the current price zone
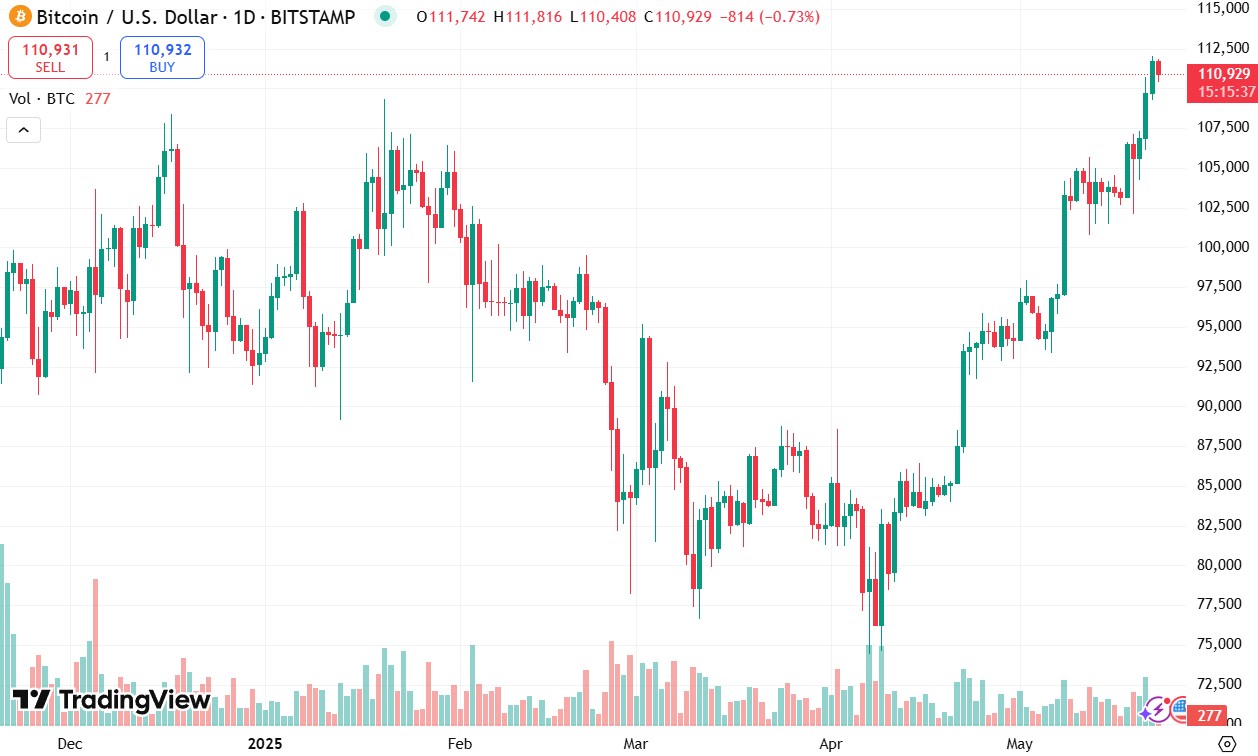
Source: Tradingview
This suggests that price discovery is now in full effect, and the market is searching for a new ceiling — a phase we haven’t seen since 2021.
On-Chain Insight: MVRV Ratio at 2.4 – Bullish, Not Overheated
One of the most reliable on-chain metrics for identifying market tops and bottoms is the MVRV ratio (Market Value to Realized Value). Historically:
- Values above 3.7 have signaled major market tops
- Values below 1 have indicated market bottoms
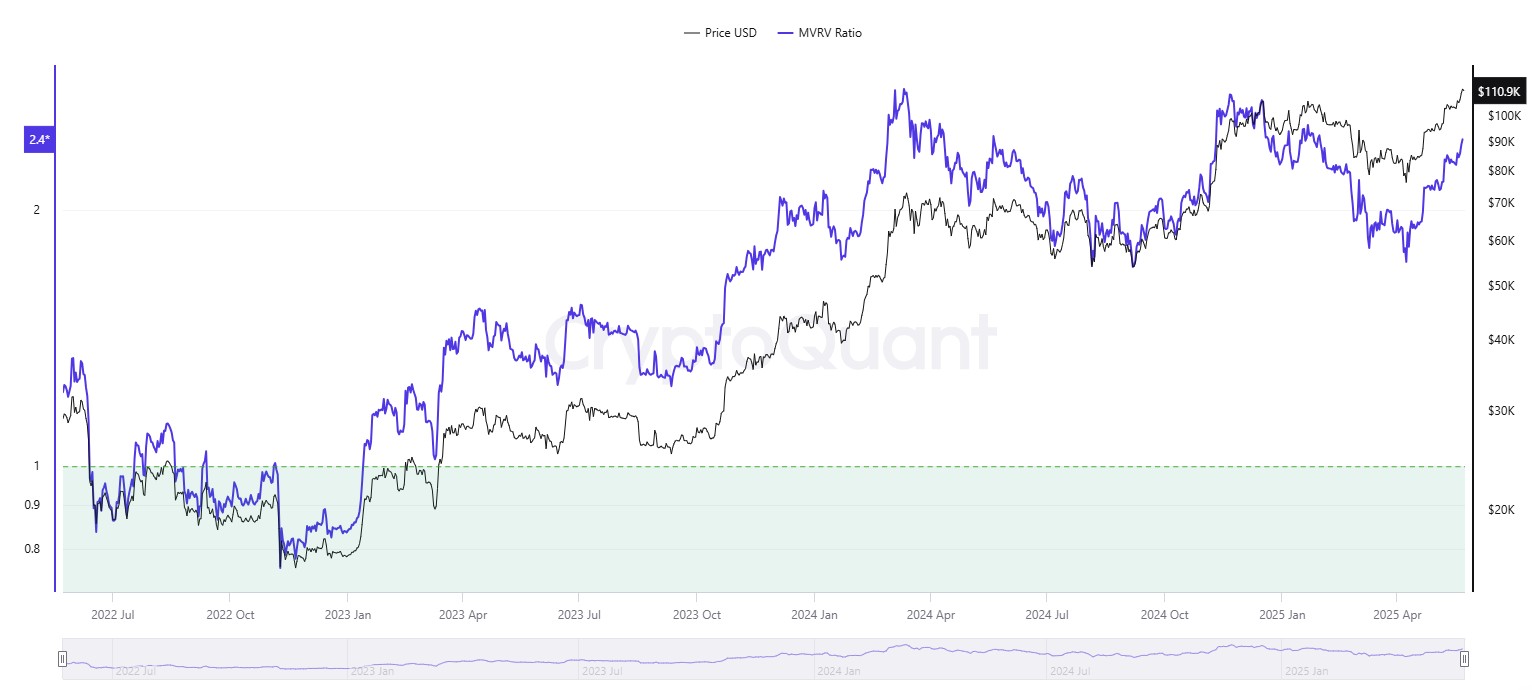
Source: CryptoQuant
As of today, the MVRV stands at 2.4 — which is high, but not extreme. This places Bitcoin in a strong bull market phase, but not yet in bubble territory. It also suggests that many long-term holders are still holding onto profits rather than rushing to sell — a healthy sign.
Macro Context: Institutions Are Buying, Sentiment Turns Positive
The broader environment around Bitcoin is also playing a supportive role in this breakout.
- U.S. macro indicators show signs of easing inflation, fueling renewed appetite for risk-on assets like crypto.
- The regulatory landscape is becoming more favorable, with recent steps forward on stablecoin frameworks and digital asset clarity in key jurisdictions.
- Market sentiment has shifted into bullish territory, but without the excessive leverage or hype that often precedes corrections.
This combination of macro stability and improved investor confidence is giving Bitcoin room to expand — without signs of froth or market overheating.
What’s Next? Key Levels and Possible Scenarios
While the price is in uncharted territory, some analysts are now watching the $115K–$120K zone as the next psychological milestone. However, it’s worth noting:
- Momentum indicators like RSI are climbing but not yet overbought
- Funding rates remain neutral to slightly positive, signaling the move is not overly driven by leverage
If current sentiment holds and no macro shocks occur, Bitcoin could continue its rally into early June, with minor pullbacks along the way.
Final Thoughts: A Rally Built on Stronger Foundations
Bitcoin has reached $112,000 — but more importantly, it has done so with strong on-chain support, healthy derivatives data, and real institutional interest. The MVRV ratio shows this is a bull market, not a mania.While short-term volatility is always possible, the current signals suggest that this rally is far from over — and investors are watching closely for the next leg higher.