The bitcoin price is once again testing key resistance around the $102,000 mark — a level that traders are now eyeing with increasing caution. After a sharp rally from the $92K zone in early May, momentum appears to be slowing, and some analysts are warning of a potential double top formation.
As the broader crypto market continues to shift capital into altcoins, Bitcoin is showing signs of indecision. The question now is whether BTC can break higher or if a local top is forming.


Bitcoin Price Chart Suggest Double Top Around $104K
The current bitcoin price action is drawing attention due to the chart pattern forming on the daily timeframe. After peaking at $104,126 on May 13, BTC has pulled back slightly and is now struggling to maintain upward momentum. This echoes a previous top at similar levels in March, raising concerns about a possible double top — a historically bearish pattern that can signal reversal if confirmed by volume and price rejection.

Source: Tradingview
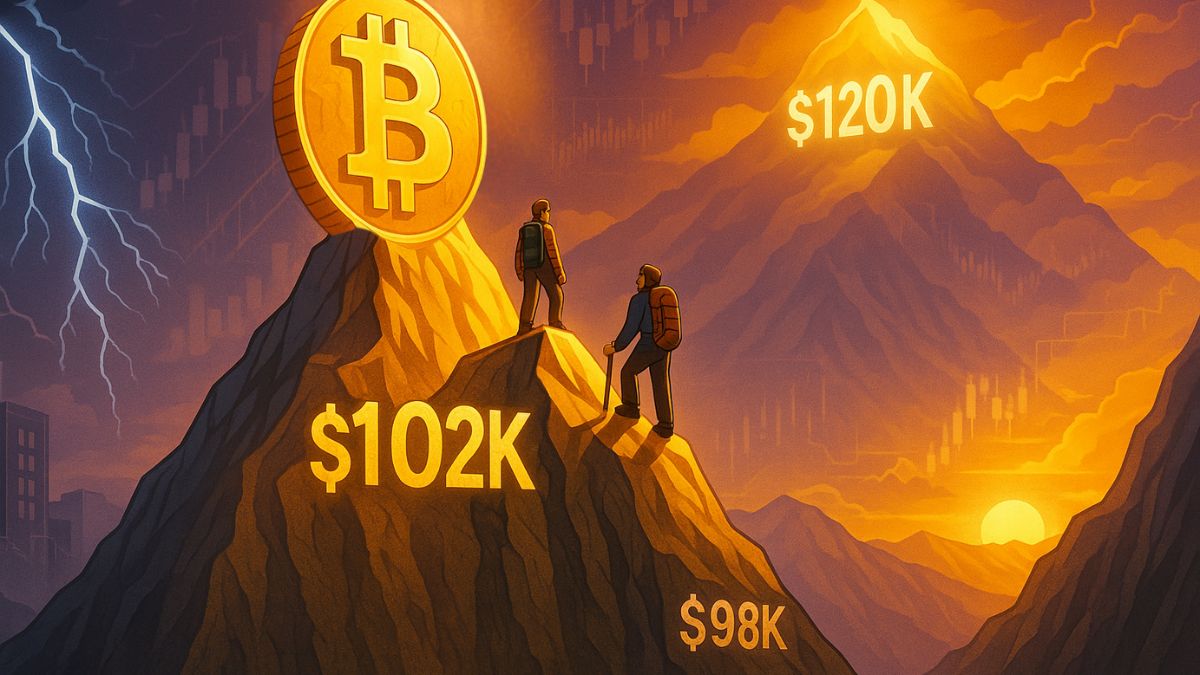
So far, the $100K level remains strong support, but traders are closely watching for a break below $98K, which could trigger a deeper correction. On the upside, a breakout above $105K would invalidate the bearish setup and likely accelerate the move toward $120K.
Exchange Reserves Hit New Lows – Bullish Long-Term?
Despite the short-term uncertainty, on-chain data paints a bullish longer-term picture. According to CryptoQuant, BTC reserves on centralized exchanges have now dropped to their lowest level in over five years — below 2.4 million BTC.

Source: CryptoQuant
This steady outflow suggests that holders are moving their coins to cold storage, reflecting increased conviction and reduced sell pressure. In previous cycles, similar patterns preceded major upside moves as supply tightened.
HODL Waves Indicate Market Still Has Room to Run
Supporting the bullish outlook, a new chart from Bitcoin Magazine Pro shows that the current market is still far from overheated. The Realized Cap HODL Waves reveal that long-term holders are still dominating the market, with short-term speculators yet to flood in.
Final Thoughts: $98K or $120K Next?
The next move for Bitcoin could be decisive. On one hand, the chart warns of a possible double top; on the other, on-chain data and HODL behavior suggest a strong underlying trend.
If BTC breaks above $105K with volume, the path to $120K opens up. But if support near $98K fails, a short-term correction could play out — possibly offering a last dip before the next leg up.
One thing is clear: long-term conviction is growing, and the supply side continues to shrink.