Bitcoin is holding firm above $94,000, showing impressive resilience as the market eyes a potential breakout past $96,000. After a period of sideways movement, fresh bullish signals are emerging, fueled by whale accumulation, improving sentiment, and key technical patterns.
Let’s dive into what’s happening — and what Bitcoin needs to keep climbing.


Bitcoin Price Action: Key Levels to Watch
After briefly dipping to the $92,000 area earlier this month, Bitcoin has regained momentum and is now consolidating between $94,000 and $95,000.
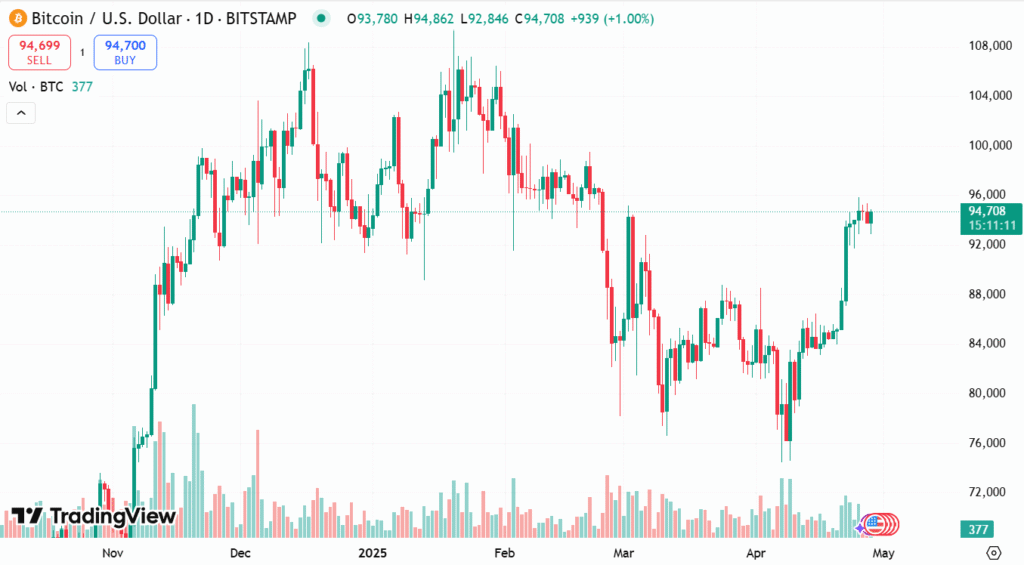
Source: Tradingview
Technical analysis highlights several crucial zones:
- Support: $92,000–$93,000 remains the primary defense line.
- Immediate resistance: $95,800–$96,300 is the next major hurdle.
- Psychological target: $100,000 remains the big milestone that could attract massive attention.
Trading volume has remained steady, while the Relative Strength Index (RSI) is climbing back into neutral territory around 54 — a sign of strengthening momentum without being overbought. Meanwhile, the MACD indicator is showing a fresh bullish crossover on the daily chart, often a precursor to continued upside.
If Bitcoin can break and close above $96,300 with strong volume, analysts suggest a quick move toward $98,000–$100,000 could follow.
Whale Accumulation and Sentiment Shift
Beyond charts, market sentiment is quietly improving — and major figures are taking note.
Binance founder CZ posted a lighthearted but telling message on X (formerly Twitter):

The post, viewed by over 1.7 million users, reflects a growing confidence among crypto insiders that the worst of the recent volatility may be behind us.
On-chain data backs this up: whale wallets have steadily accumulated more BTC over the past two weeks, with large transactions increasing on major exchanges. Historically, such activity often precedes significant upward moves.
Technical Indicators: Bullish or Cautious?
Technical indicators are beginning to align in Bitcoin’s favor:
- RSI: Climbing steadily, signaling renewed buying interest without overheating.
- MACD: Positive crossover forming, often associated with new uptrends.
- Price structure: Bitcoin is forming an ascending triangle — a bullish pattern that often resolves higher.
However, caution is still warranted. A failure to break $96,300 convincingly could lead to another retest of the $92,000 support zone. Traders are watching for volume confirmation and any macroeconomic surprises that could impact risk assets broadly.
Final Thoughts: What’s Next for Bitcoin?
Bitcoin’s ability to hold above $94,000 despite recent ETF outflows and market uncertainty is a strong signal. With whale accumulation intensifying, bullish technical patterns forming, and sentiment improving among crypto veterans, BTC could be setting the stage for a new leg up.
If buyers can push Bitcoin through the $96,300 resistance level with conviction, the path toward $100,000 could open faster than many expect.
As always, short-term volatility is part of the journey — but the broader trend looks increasingly promising.